I Created Custom Procedurally Generated Truchet-Tiled Open Graph Images for This Blog

I love Truchet tiles, which are square tiles that form interesting patterns when you tile them on the plane. The idea that some basic shapes, like the triangles above, can form elaborate emergent patterns when tiled in interesting combinations, fits in nicely with my interests of quilting and drawing geometric abstract shapes, which are both things I do in my spare time.
I recently rediscovered the Truchet tiles by Christopher Carlson; he is also a mathy quilter to some extent, but I rediscovered his work thanks to Alex Chan, who blogged about recreating the Carlson tiles in SVG in order to use them as blog headers. That tripped something in my brain, and I remembered reading Cassidy Williams’s post about generating custom open graph images last year, and obviously I needed to smash these things together.
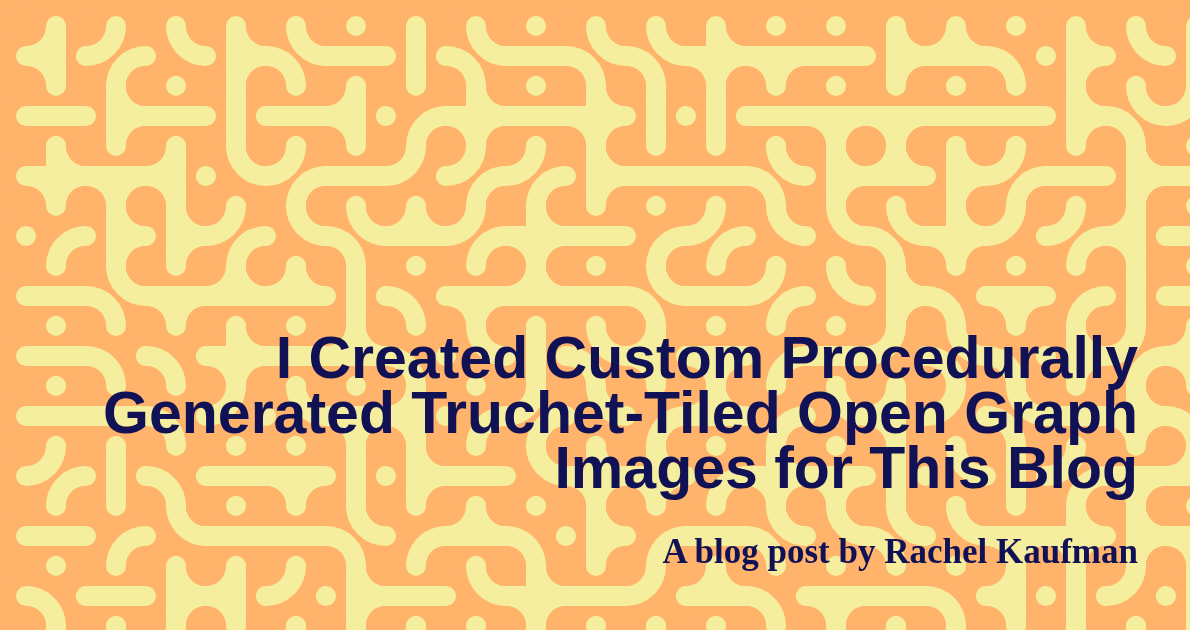
The result is a custom image for every blog post that is used in the og:image tag in its header, which is what controls how posts are previewed when shared on social media, within Slack, etc. Each image has a unique, procedurally generated tiled background unique to only it1, plus the title of the post and my name. Here’s what this post’s image looks like:
So now I’ve covered why I built this (I got nerdsniped over winter break), but how did I do it? Read on to hear about that.
I will add the disclaimer that there are probably much easier ways to achieve the same end result. Somehow I just got hung up on “do the thing Alex Chan did and then combine it with the thing Cassidy Williams did” and that was the architecture I ended up following. I’m curious how others would implement this while starting from scratch – please reach out!
Creating the template
Here I basically followed Alex Chan’s pseudocode, but as I don’t think they were writing with the intention of someone coming along and wholesale lifting borrowing it into their own project (fair), I did have to do a lot of tweaking. Essentialy, you define a set of base tiles as SVG that can be used to create all the shapes in the set, then you define all the shapes in the set, and then you use Javascript to randomly pick a tile from the bag and place it in your image:
tilePositions.forEach(c => {
    let tileName =  tileTypes[Math.floor(Math.random() * tileTypes.length)];

    svg.innerHTML += `
      <use
        href="#${tileName}"
        x="${c.x }"
        y="${c.y }"
        transform="translate(${padding} ${padding}) scale(5)"/>`;
  });
In Chan’s initial implementation (as well as Carlson’s) there’s also the complexity of the Truchet tiles working at multiple scales. While this is the coolest part of the original project, mathematically speaking, I a) didn’t love the look of the smaller tiles and b) couldn’t figure out the fiddly padding, even with Chan’s pseudocode, so mine is just a single layer of tiles of a single size. I dumped all this into a single HTML file that lives on my computer.
Once I had the background, I needed to add some text. There are many approaches to this, but I decided to add a query param to the local HTML file which would take in text and render it to the SVG using the <text> element.
That looked like this:
 const text = new URLSearchParams(window.location.search);
 svg.innerHTML+=`
  <text class="regular" style="font: bold 30px sans-serif; text-anchor:end" x=1140 y=250 >${text.get("foo")}</text>
  `;
This worked fine…until it didn’t. SVG text positioning is a little janky and you don’t have as many levers to pull as with regular HTML text positioning. And we have to handle our own linebreaks.
What I ended up doing is pretty hacky, but it works. I decided that no line should be longer than 8 words. If the input text is more than 8 words long, we divide it in roughly equal halves. (If the input text is more than 16 words long, we divide it in thirds.) Then each line of text is output into the SVG with a vertical offset.
That looks roughly like this:
function splitTextToLines(text){

const result = text.split(" ")

if (result.length<8){
  return [text]}
  else if (16>result.length){
    const first = result.slice(0,Math.ceil(result.length/2));
    const second = result.slice(Math.ceil(result.length/2));

    return [first.join(" "),second.join(" ")]
  } else {
    const first = result.slice(0,Math.ceil(result.length/3));
    const second = result.slice(Math.ceil(result.length/3),Math.ceil(result.length/3)*2);
    const third = result.slice(Math.ceil(result.length/3)*2);

    return [first.join(" "),second.join(" "),third.join(" ")]
  }
}
And the loop that actually renders the text to the image:
const lines = splitTextToLines(text);
y-=lines.length*45;
for (let i=0;i<lines.length;i++){

  svg.innerHTML+=`
  <text class="regular" style="font: bold ${fontSize}px sans-serif; text-anchor:end" x=1140 y=${y+i*65} >${lines[i]}</text>
  `;
}
I got the numbers right by just generating a lot of text and manually tweaking it. I like the end result, although it’s definitely not perfect and might still fall down with edge cases of really long or really short words.
Finally, I defined a handful of palettes that I like looking at and that vaguely go with the color scheme (such as it is) of this blog. The script selects one at random and injects a stylesheet to color the foreground and background of the tiles, as well as the text.
Creating the images
To actually create the images from the template, I wrote my first Jekyll plugin! Here, I am quite grateful to this 8-year-old gist that did close to what I wanted to do. Instead of generating the image with ImageMagick (which is also extremely cool!!!), I added code that uses Ruby Puppetteer to load the file and save a screenshot to the /assets/opengraph folder, returning the path to the file. The code is then registered as a Jekyll tag called og_image. This means…
Putting it all together
All I need to do to generate and use these images is edit my head.html layout like so:
{% if page.image %}
    <meta property="og:image" content="{{ page.image }}">
    {%else %}
    <meta property="og:image" content="{{site.url}}{% og_image %}">
  {% endif %}
Now, if the page has an image defined in its front matter, Jekyll will use that. Otherwise, Jekyll will generate an image using the plugin and refer to that.
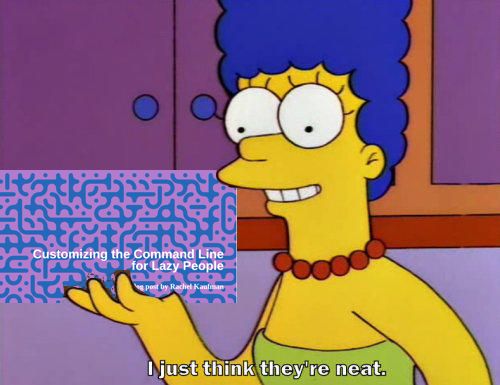
I’ve wanted to do something like this for some time. I’m not sure how many people will ever see these, which makes me feel a little insane, but, well:
Resources
- Drawing Truchet tiles in SVG
- Multiscale Truchet Tiles
- Generating open graph images in Astro
- Dynamically generated open graph images in Jekyll
Footnotes
-
With 14 tiles to choose from, 540 tile positions, and 3 color palettes, the odds of a repeat are… low. #math ↩