Six Things I Bet You Didn't Know You Could Do With Chrome's Devtools, Part 1
I just got back from TechBash conference in Pennsylvania. It was a great couple of days of meeting new people, reconnecting with old friends, and of course learning a ton.
Many of the sessions I went to were fantastic, but my favorite session by far was by Mike Rapa about the power of the browser’s devtools. His presentation was (mostly) browser-agnostic, with the exception of a few things, because (and I can attest to this) Firefox’s devtools have markedly improved over the last few years. This post, however, is specific to Chrome, for reasons you will see soon.
So, with thanks to Mike, and a few other sources, here are six things I bet you didn’t know you could do with Chrome’s devtools.
This is part 1 of this topic, covering items 1-3. I wrote way too much for a single post!
In this post we’ll cover:
- Time functions with
console.time()andconsole.timeEnd() - Watch any DOM element for changes
- Monitor any function in the browser’s context
In the second post, coming soon, we’ll cover:
- Edit any website WYSIWYG style
- Record and replay any user actions
- Throttle only specific network requests
So let’s get going!
-
Time functions with
console.timeandconsole.timeEndI have been vaguely aware of the idea that
console.log()is just one method available in a vast cornucopia of logging methods, and I have dabbled withconsole.warn()andconsole.error(). I cannot say that I have ever usedconsole.table(), although I knew it existed.Had I ever, however, even heard of
console.time()andconsole.timeEnd()? No, and I bet most people haven’t. I recently needed to track down a bug where awindow.setTimeoutfunction seemed to be clearing itself earlier than expected, and so I wanted to log when a timer was set, for how long it was supposed to be set for, and when that timer cleared. Searching around yielded a lot of people suggesting complex options, including overloadingconsole, writing wrapper functions, and so on, implying that these built-in functions are not part of most folks’ knowledge.On the other hand,
console.time()andconsole.timeEnd()seem like just what the doctor ordered.Example from MDN:
 console.time("answer time");
 alert("Click to continue");
 console.timeLog("answer time");
 alert("Do a bunch of other stuff…");
 console.timeEnd("answer time");
More interesting example:
     const [paused,setPaused] = useState(false);
     const [timeoutId,setTimeoutId] = useState();

     const handleClick = ()=>{
         if (paused){
             console.log("unpausing")
             clearTimeout(timeoutId);
             console.timeEnd(timeoutId.toString());
             setPaused(false);
         } else {
             console.log("pausing for 5 s, or when the user clicks the button next, whichever comes first")
             setPaused(true);
             const timeout = setTimeout(()=>setPaused(false),5000);
             console.time(timeout.toString());
             setTimeoutId(timeout)
         }
     }

     return (<>
     <button onClick={handleClick}>{paused?"Unpause":"Pause"}</button>
     </>);
Source: Mike Rapa’s talk, which I couldn’t find a recording of, but the github repo is here and is fantastic.
Support: This is part of JS, so any browser.
-
Watch a DOM element for changes and pause app execution when it does.
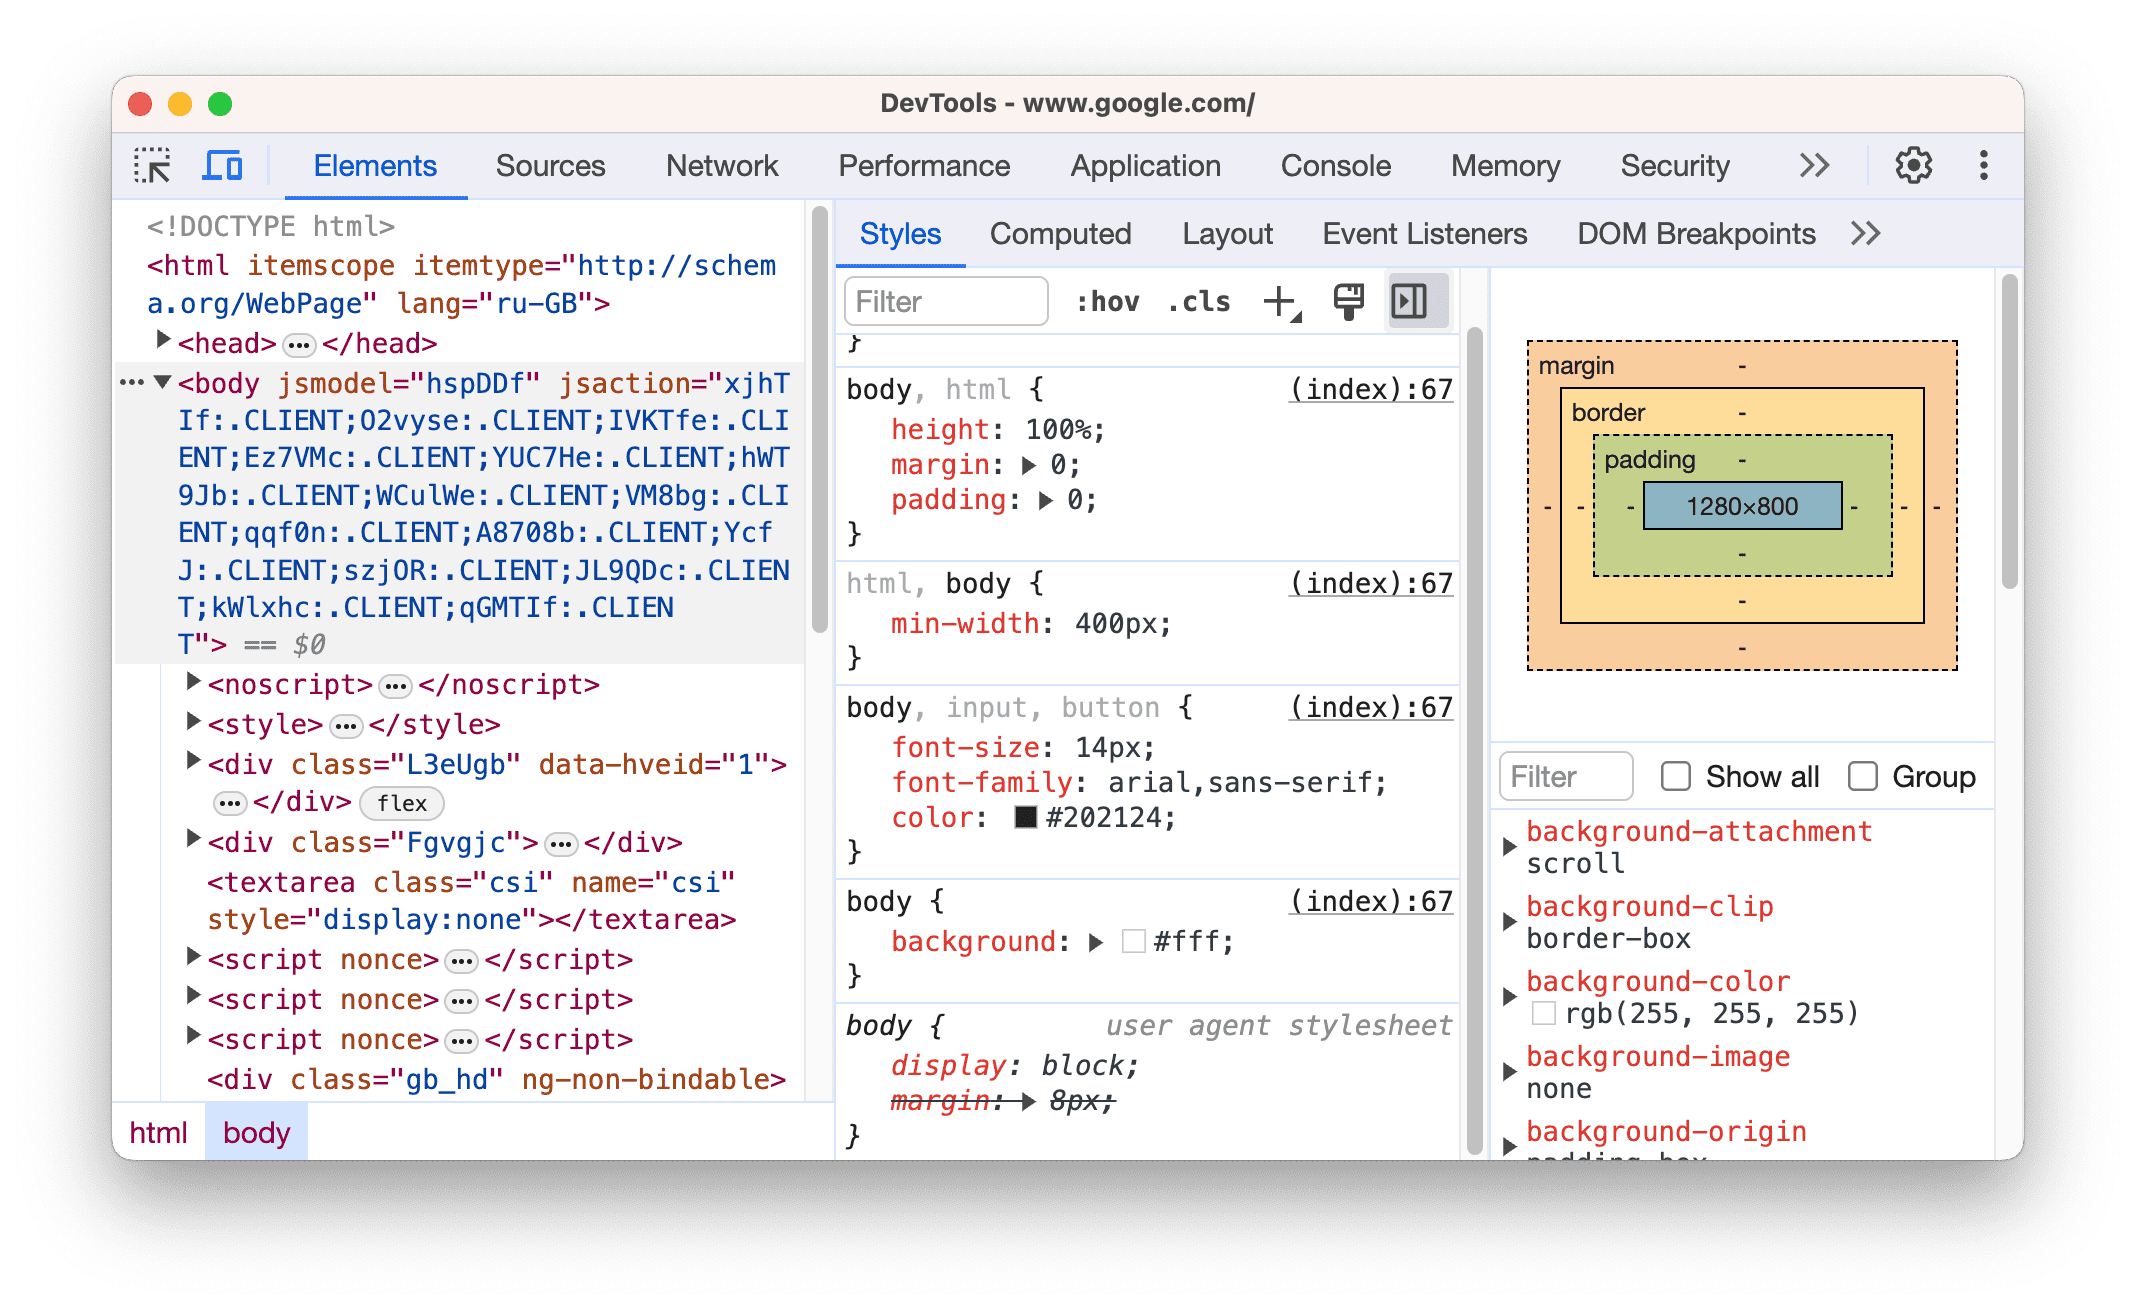
The DOM Breakpoints option lets you select an element from the DOM and, when something on the page would cause it to change, pause execution of the JS that is causing the change, entering Chrome’s debugger mode. I have known about placing
debugger;on a line in my JS/React to trigger debug mode, and of course there’s also the pause button on the Debugger tab, but a DOM breakpoint was also new to me.Visit this SO page and run the code snippet in the answer. If you inspect the element as it’s running, you can see the DOM highlight as it updates:
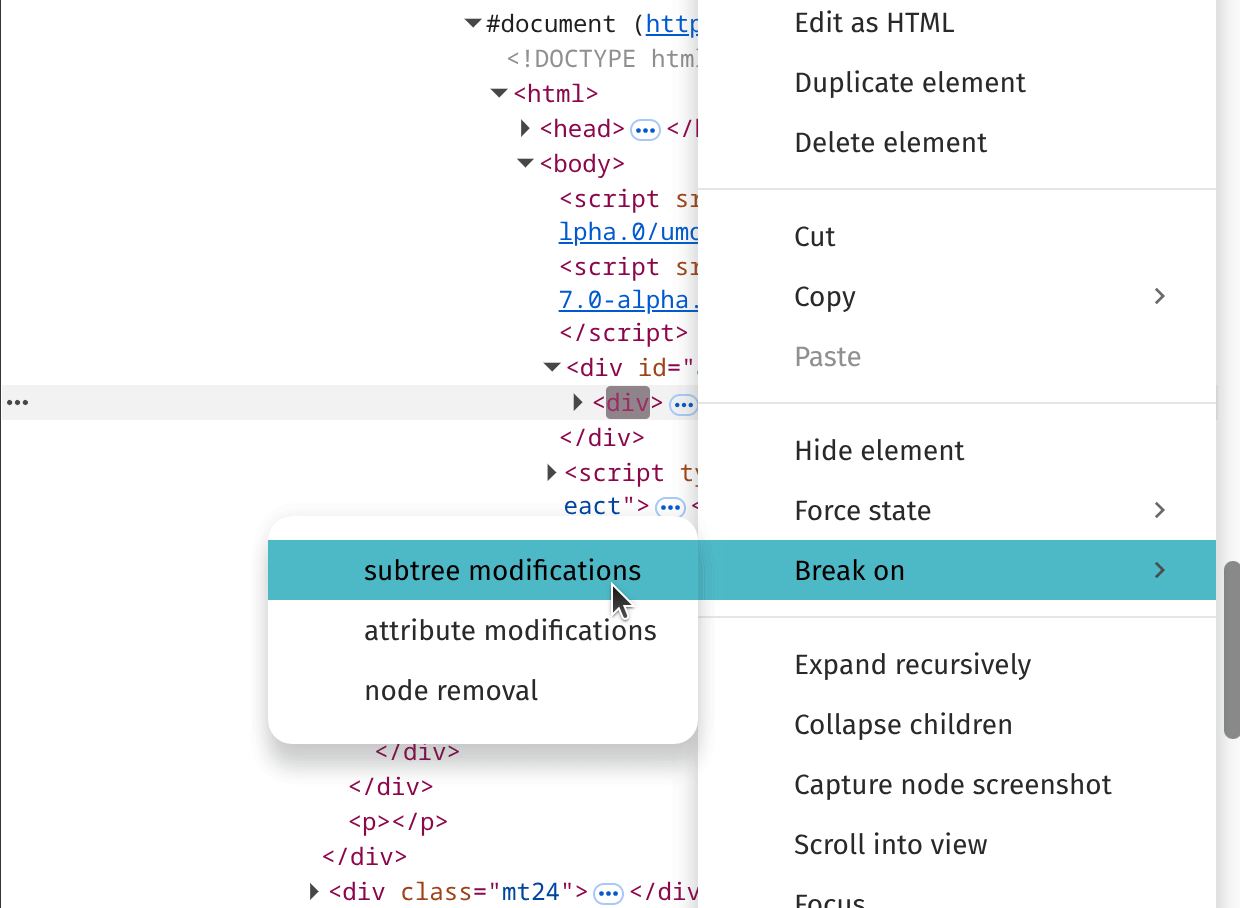
If you were to right click on it, choose “Break On”, and one of the options, you will now hit a breakpoint when that DOM element is modified, allowing you to see what Javascript is affecting this element.
Source: Mike Rapa’s talk
Support: Most major browsers, although Firefox behaves slightly differently than Chrome
-
Attach a listener to any function on the page
Say you’re debugging some interaction in some third-party script that you don’t control. (Something that used to come up a lot on my old team.) You’d like to know when the third-party script is doing something, but you can’t exactly go into that script’s code and add
console.log()(or one of the fancy console methods that we just learned about).Chrome lets you attach a listener to any function in the browser’s context, with
monitor.Contrived example:
 function sum(x, y) {
     return x + y;
 }
 monitor(sum);
 sum(1,2) //results in console.log message: "Function sum called with arguments: 1,2"
Source: Google documentation
Support: Chrome only
That’s it for the first half of this post! Come back later to see the next three tips.